Measuring Poverty or ‘Prettifying’ Neo-Liberalism?
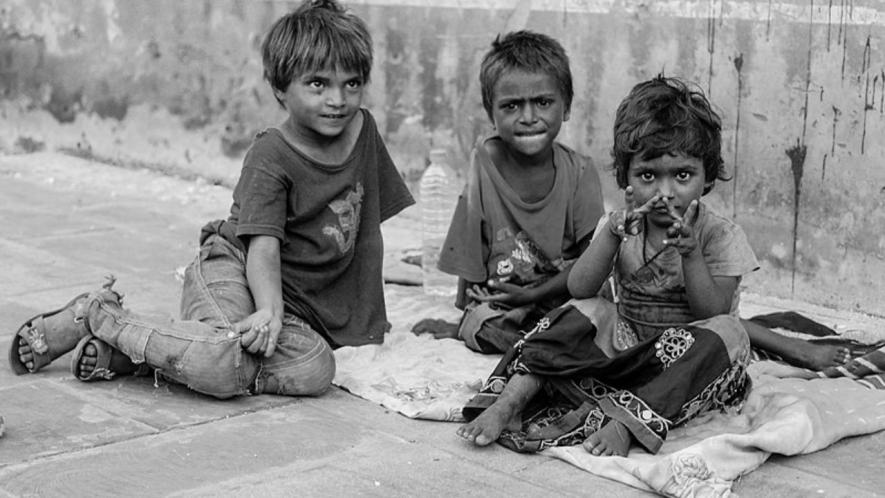
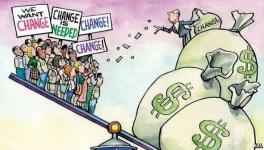
Representational Image. Image Courtesy: Wikimedia Commons
Several international organisations are now engaged in the business of measuring what they call “poverty”. The World Bank has been in it for some time, but now we have a new measure of “Multidimensional Poverty” brought out by the United Nations Development Programme (UNDP) and the Oxford Poverty and Human Development Initiative (OPHI). Neither of these measures, however, actually measures poverty; they typically end up “prettifying” neo-liberal capitalism.
In fact, according to the World Bank’s estimate, the proportion of the world’s population that lives in “extreme poverty” (that is, below a daily per capita expenditure of $1.90 at 2011 purchasing power parity exchange rate) has gone down from over 30% in the late 1990s to less than 10% in 2022, suggesting that under neo-liberal capitalism “millions have been lifted out of poverty”. Let us see why this much-quoted World Bank’s measure is conceptually flawed.
There are three basic problems with the World Bank’s measure: first, it makes no reference to a person’s asset position but only to that person’s income position. Second, it takes expenditure as a proxy for income. And third, for measuring real expenditure, it uses a price-index that grossly understates the actual increase in cost of living. The figures it gets, therefore, are grossly erroneous. Let us examine each of these points.
Any meaningful measure of poverty must have a “flow” dimension covering, say, income, and a “stock” dimension covering asset ownership. Both dimensions are important. For instance, if persons have the same real income between two dates but have lost all their assets by the later date, then it would be a travesty not to see them as having become poorer.
For one, the World Bank’s measure, however, makes no reference to the asset position of persons, which is a particularly glaring omission under neo-liberal capitalism, when the process of primitive accumulation of capital, that is, of the dispossession of individuals from their assets, is rampant. To say that “millions have been lifted out from poverty” when such rampant dispossession is occurring, constitutes supreme irony.
Second, even real income is not covered by this measure, since income data are not available in most countries, including India; besides, “income” is a conceptually complex entity. Typically, therefore, expenditure, on which data are more easily available and which is a conceptually simpler entity, is taken as a proxy for income.
But this makes the ignoring of a person’s net asset position even more unforgivable. Even when the income of persons goes down, they can maintain the earlier level of expenditure by running down assets or by borrowing. To conclude from this that the persons concerned have not become poorer because their expenditure has remained unchanged, would be quite absurd. In fact, both in flow terms, namely income, and in stock terms, namely net assets, these persons have become unambiguously poorer, but the measure based on expenditure would show the persons to be at the same level as before.
Third, the measurement of real expenditure even for countries like India, where we have money expenditure data for households through careful sample surveys carried out periodically, is grossly erroneous, since the price-index used for deflating such nominal expenditure understates the actual rise in cost of living.
The price-index used is a weighted average of individual price relatives for a bunch of commodities consumed in the base year. This is erroneous because important changes take place in the composition of the consumption basket following the base year owing to the non-availability of base year goods; the effects of such changes go unrecognised.
Under neo-liberalism, for instance, the privatisation of a range of services, such as education and healthcare that were earlier provided by public institutions, is a common phenomenon, which raises greatly the cost of these services to the people; but this is not captured by the price-index.
For instance, if a surgery in a public hospital which used to cost Rs 1,000 in the base year, costs Rs 2,000 now, then the price-index will take healthcare costs as having doubled; but the fact that the number of surgeries carried out in the public hospital has remained unchanged or even declined, because of which people are now forced to go to private hospitals, where the same surgery costs Rs 10,000, is not captured by the price-index.
The actual cost of living, in short, has increased to a far greater extent than shown by the price-index that is used to deflate nominal expenditure for obtaining “real” expenditure. Deflation by the official price-index, therefore, exaggerates the improvement in people’s living standards and hence seriously underestimates poverty.
Whenever people are squeezed by cost-of-living increases that make it difficult for them to make ends meet, they adjust in at least two distinct ways: first, by running down assets or running up debts, and second, by changing the composition of their consumption such that items considered “essential” are given priority over other items considered less essential.
The rise in the cost of meeting healthcare, or of children’s educational needs has caused both these adjustments in India: there has been a significant worsening of the net asset position of Indian households, especially in rural areas; and there has also been a skimping on household nutritional intake in the (mistaken) belief that economising on the nutritional intake does not matter much.
The All India Debt and Investment Survey of 2019 (which gives information as on end-June 2018), when compared with the AIRDIS for 2013 (which gives information as on end-June 2012), shows the following (all comparisons are of “real” as opposed to nominal figures, which have been deflated by the wholesale price index): first, 11% more rural households were indebted on the latter date; second, the average amount of debt per indebted rural household increased by 43% by the latter date; third, the average value of assets per cultivator household declined by 33% between the two dates and for non-cultivator households by 1%.
The picture is broadly similar for urban India. There was a decline in the average value of asset per household (29% for self-employed households and 3% for others); and while the percentage of indebted households remained more or less the same as before, the average amount of debt per indebted household increased by 24% between the two dates. It is an indubitable fact, in other words, that the net asset position of the bulk of Indian households has declined significantly.
The second kind of adjustment has also been occurring. The proportion of the rural population that does not have access to 2,200 calories per person per day has increased from 58% to 68% between 1993-94 and 2011-12; the proportion in urban India not having access to 2,100 calories (the corresponding benchmark used by the erstwhile Planning Commission) increased from 57% to 65% between these two dates.
The 2017-18 results of the National Sample Survey were so dismal, showing decline in real spending on all goods and services, that they were quickly withdrawn from the public domain by the National Democratic Alliance government.
From whatever data were available prior to this withdrawal (and assuming that the real food cost per unit of nutrients remained unchanged), it turns out that while the urban percentage was more or less the same as in 2011-12, the rural percentage had increased to well over 80%. (These figures are taken from Utsa Patnaik’s forthcoming book on poverty).
In contrast to this grim reality, the World Bank’s “extreme poverty” measure which, as already mentioned, takes a daily expenditure of less than $1.90 (at the 2011 purchasing power parity exchange rate) as its definition, shows a decline for India from around 12% in 2011-12, itself a gross underestimate, to just 2% in 2022-23.
Incidentally, the World Bank’s yardstick of $1.90 implies a poverty line in rupee terms of about Rs 53 per day for meeting all expenses. The World Bank’s yardstick is itself derived as an average of what several governments of the poor countries themselves use (invariably under Bank guidance) in their estimation of the poverty line; it is not a separate measure independently calculated. It suffers from exactly the same defects, such as underestimation of the cost-of-living increase in the price-index used for deflating nominal expenditure, that the official poverty estimates of these countries suffer from. The World Bank, in effect, gives an imprimatur to the propaganda of several Third World governments about how they have reduced or eliminated poverty.
All the talk about “millions being lifted out of poverty” is thus no more than a cruel joke. Unfortunately, one is likely to hear more such talk in the coming days as countries start vying with one another to show how they have been meeting the Sustainable Development Goals (SDGs) set by the United Nations.
Prabhat Patnaik is Professor Emeritus, Centre for Economic Studies and Planning, Jawaharlal Nehru University, New Delhi. The views are personal.
Get the latest reports & analysis with people's perspective on Protests, movements & deep analytical videos, discussions of the current affairs in your Telegram app. Subscribe to NewsClick's Telegram channel & get Real-Time updates on stories, as they get published on our website.


