Youth, Women Among Most Acutely Unemployed: PLFS 2024

Image: webapps.ilo.org
The government has released the report of the National Sample Survey Office (NSSO) prepared latest Periodic Labour Force Survey for the period of July 2023-June 2024 in September 2024. The first PLFS Survey was done during 2017-18 and a subsequent report was released, much later, in May 2019 rather than in January 2019. Many criticised this move by the government saying that the survey reported high unemployment levels which the ruling government did not want to be out. The Chairperson of National Statistical Commissions (NSC) and one of his colleagues resigned in protest of withholding of the data.
That was more than five years ago and PLFS has come to be widely relied on data on one of the most important socio-political aspects of a developing country like India—unemployment—especially in lieu of the decennial Census not being conducted. This article aims to give an overview of the some of the key findings of the recent PLFS survey and the implications for the country. Before that, a brief background into various concepts is necessary.
Brief background
Labour Force Participation Rate: Defined as number of persons/ person-days in the labour force per 1000 persons/person-days, it is indicative of people who are seeking to work/working in the total Working Age Population. Working Age Population usually means people from the ages of 15 to 65.
Worker Population Ratio: Percentage of employed persons in the overall population.
Unemployment Rate: Percentage of unemployed among the labour force.
Activity Status-Usual Status: Activity Status of a person-determined on the basis of the activities pursued by a person during the specified reference period in this case 365 Days; Determined on the basis of usual principal activity and usual subsidiary economic activity of a person—PS + SS.
Activity-Current Weekly Status: Activity Status determined on the basis of reference period of last seven days preceding the date of survey—CWS.
Key Indicators of unemployment

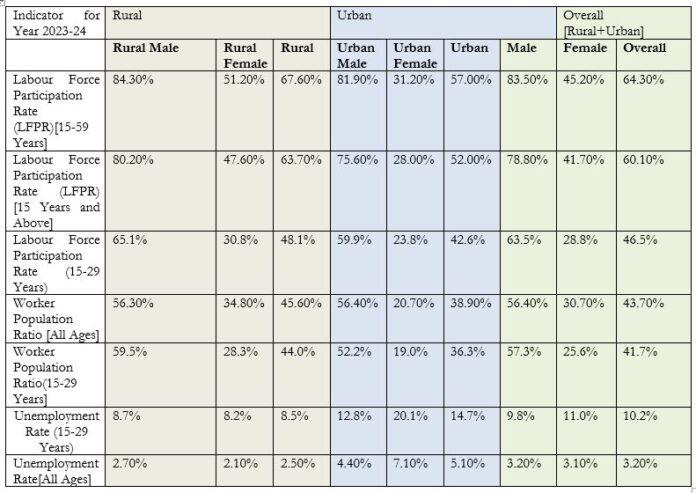
Table 1 Key Indicators of Unemployment, PLFS 2023-24.
Source: PLFS Annual Reports-2021-22;2022-23;2023-24.
Significant gender disparities in LFPR and WPR
The data for 2023-24 reveals significant insights into India’s labour market, particularly highlighting the disparity between Labour Force Participation Rate (LFPR) and Worker Population Ratio (WPR). LFPR, which measures the proportion of people actively engaged in or seeking work, is notably high in both rural and urban areas for males, with rural male LFPR at 84.3% and urban male LFPR at 81.9%. However, female LFPR lags far behind, especially in urban areas where it stands at only 31.2%. This suggests that despite economic growth and urbanisation, social and structural barriers continue to restrict women’s access to the labour market, especially in cities where opportunities are concentrated.
However, despite the relatively high LFPR, the Worker Population Ratio (WPR)—which measures the proportion of the population that is actually employed—paints a different picture. WPR for all ages is significantly lower across the board, especially for females, with rural female WPR at just 34.8% and urban female WPR at a strikingly low 20.7%. The gap between LFPR and WPR indicates that a substantial portion of those who are seeking work are not able to find it, leading to a mismatch in labour demand and supply. This could point to structural unemployment, underemployment, or job market barriers, especially for women. The overall WPR of 45.6% in rural areas and 38.9% in urban areas further underscores that the economy is not generating enough jobs relative to the number of people willing to work.
This discrepancy is particularly concerning in a developing country like India, where rapid population growth and urban migration are placing increasing pressure on labor markets. Despite the high LFPR, especially among men, the inability to translate participation into actual employment, as indicated by the lower WPR, highlights deep inefficiencies in the job market. Women, both rural and urban, face additional challenges, and this could explain their lower participation and employment rates.
Education and unemployment
In rural India, the data shows that the labour force participation rate(LFPR) for persons of age 15 years or above of different level of education is highest for diploma/certificate course—83%— i.e., those who have a diploma/certificate course are interacting with the labour market at a higher rate than those at Postgraduate and higher level being at 78.1%.
In urban India too, this trend appears, albeit at a total of lesser percentage of people interacting with labour market. Only LFPR of the Diploma/Certificate Course finishers is 78%, followed by the LFPR of people who are post graduate and above being 67.3%.
The overall LFPR for holders of Diploma/Certificate—Urban and Rural—is 80.6% while it is 71% for postgraduate and above.
The story of Women-both in terms of Diploma Course and PG Course is grim.
The LFPR of Males overall for Diploma/Certificate Course is 89.3% while it is 89.4 % for Postgraduate and Above. On the contrary, the LFPR for Females who have done Diploma Courses is only 55.8%; it is 51.1% for women in Postgraduate and above.
Essentially, despite being equipped with similar education-at higher level or even technical-women are interacting way less with the labour market than men do.
Trends over the past three Years can be found here.
The data over the past three years reveals a consistent increase in the Labour Force Participation Rate (LFPR) and Worker Population Ratio (WPR) for both rural and urban women across all age groups between 2021-2024, particularly for rural women. The LFPR for rural women in the 15 years and above category rose significantly from 36.6% in 2021-22 to 47.6% in 2023-24, while urban women saw a more modest rise from 23.8% to 28% during the same period. This suggests greater integration of women into the labour force, with rural areas witnessing a more pronounced shift, likely due to a combination of economic necessity and possibly greater access to employment opportunities outside traditional agriculture.
On the other hand, despite these gains, the unemployment rate for urban women remains higher compared to their rural counterparts. For instance, in the 15-29 years age group, the unemployment rate for urban women stood at 20.1% in 2023-24, whereas rural women had a lower unemployment rate of 8.2%. This disparity hints at structural challenges in urban areas, where higher female participation does not necessarily translate into employment, possibly due to skill mismatches or fewer suitable job opportunities. The rural-urban divide in both labor participation and unemployment highlights the differing socio-economic conditions that affect women’s integration into the workforce across regions.
Conclusion
Despite progress in education and qualifications, female labour force participation, especially in urban areas, remains significantly lower than that of men. This points to enduring social, structural, and economic barriers that hinder women’s full participation in the workforce.
At the same time, the overall Worker Population Ratio (WPR) and Unemployment Rate (UR) figures reveal a mismatch between the number of people seeking work and those actually employed. While labour force participation, particularly among men, has remained relatively high, the economy struggles to generate sufficient employment opportunities, as evidenced by lower WPRs and higher unemployment rates, particularly for young people and women.
While the PLFS data shows incremental improvements in certain areas, it underscores the need for targeted policies to bridge the gender gap in employment, address underemployment, and create more equitable labor market opportunities. Achieving sustainable economic development in India will require a comprehensive approach that fosters job creation, ensures gender inclusivity, and aligns educational outcomes with employment opportunities.
PDF here
Table 2.0: Data of Employment Indicators for the years 2021-22, 2022-23 and 2023-24.
Source: PLFS Annual Reports-2021-22;2022-23;2023-24.
Get the latest reports & analysis with people's perspective on Protests, movements & deep analytical videos, discussions of the current affairs in your Telegram app. Subscribe to NewsClick's Telegram channel & get Real-Time updates on stories, as they get published on our website.


